Every page so far fixed the number of masses in advance — detection with the answer key half-open. Real detection must infer the model, not just its parameters. The Bayesian answer is to run a separate particle filter for each candidate count \(K\) and compare evidence: the marginal probability each model assigned to the data. The implementation accumulates pre-resampling normalizing-constant increments through each adaptive tempering stage. At finite particle count this is a stochastic SMC estimate, not an exact or deterministic integral.
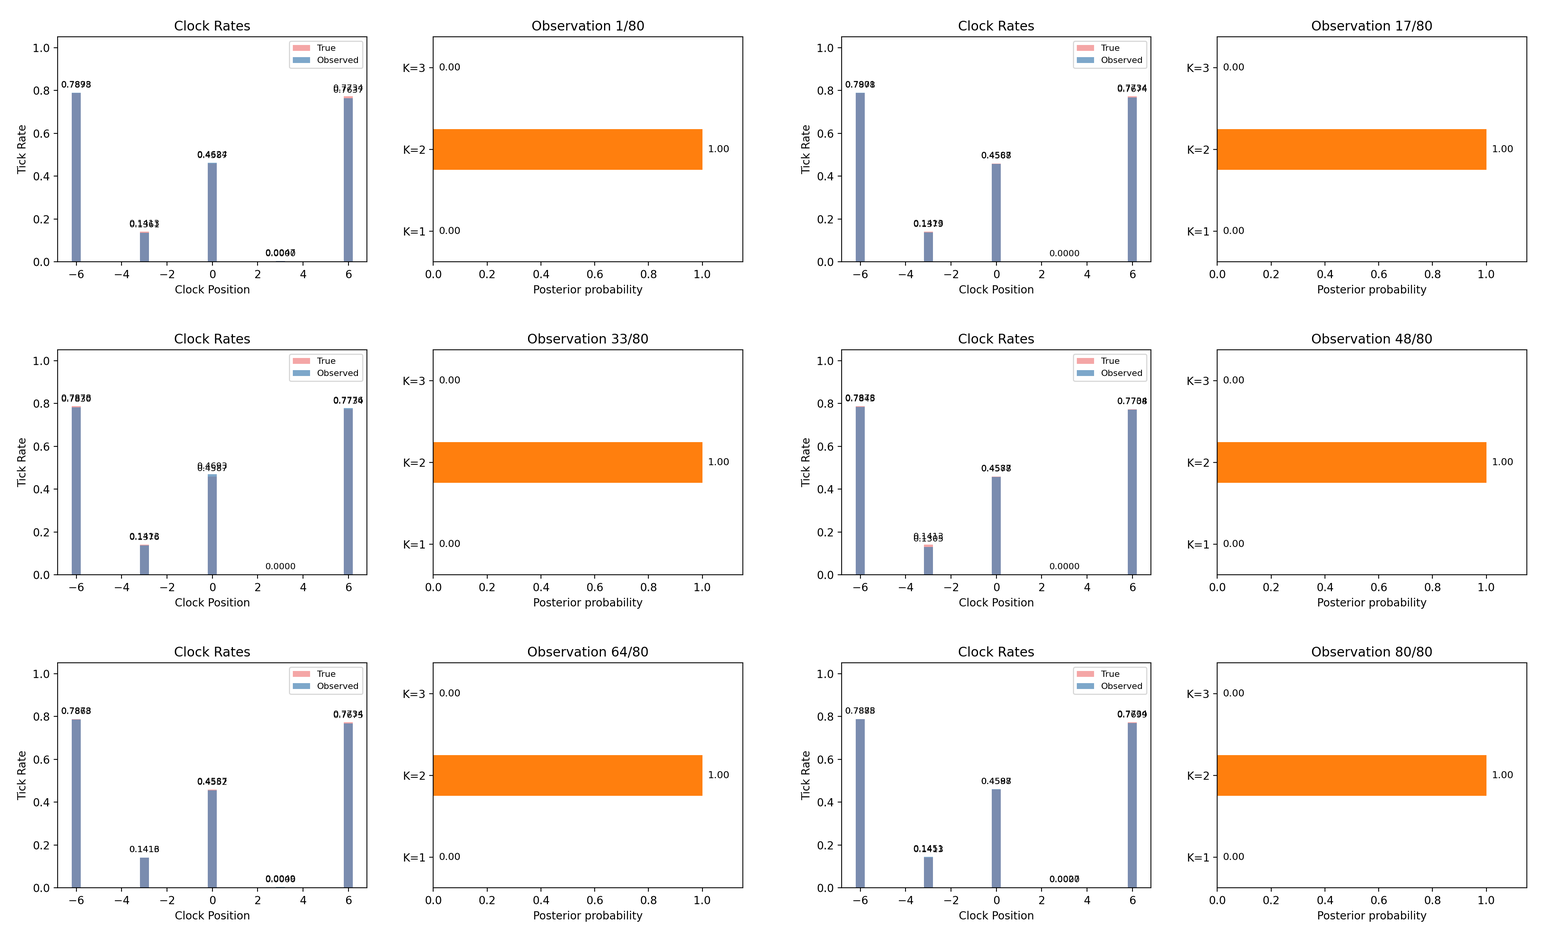
Current 80-observation model-comparison run over K=1, 2, 3: truth is K=2, while the final estimate mildly favors K=3.
This committed GIF is the current packaged default run: 80 observations, 2,000 particles per candidate, and seed 42. With K=2 truth, its final estimate is K=2: 0.3990 and K=3: 0.6010, so this realization mildly prefers K=3. That is an honest finite-data, finite-particle result—not a claim that K=3 is the data-generating model or that model comparison must recover truth every time.
Occam’s razor, automatic
Why should \(K=3\) not win automatically? A three-mass model can approximate many two-mass configurations by pushing the extra mass toward the lower prior bound or into a weakly visible location. Here that lower bound is strictly positive and positions are bounded, so the candidate models are not guaranteed to be nested: a larger \(K\) need not have an equally good best fit. Evidence instead averages the likelihood over the model’s whole prior. Extra parameters spread that average across vast regions of configuration space the data rejects, and the dilution is the tax. Complexity isn’t punished by rule; it is punished by arithmetic. Here each model’s prior is a normalized uniform rectangle conditioned on its configured bounds, strict mass ordering by first spatial coordinate, and weak-field validity, so that support is part of the comparison.
Run it live
(One geometric note: this scenario keeps the second mass at \(x = 3.0\), directly atop a clock — the placement the previous page avoided for parameter estimation. It is retained here as part of the fixed scenario, not as a guarantee that the evidence estimate will select the true count.)
Code
import matplotlib.pyplot as pltimport numpy as npfrom clocks import ( ClockArray, InferenceConfig, MassConfig, NoiseConfig, PriorConfig, SimulationConfig, infer, simulate,)clock_array = ClockArray( positions=np.array([[-6.0], [-3.0], [0.0], [3.0], [6.0]]), track_offset=1.0)truth = MassConfig(positions=np.array([[-2.0], [3.0]]), masses=np.array([0.045, 0.030]))sim = simulate(SimulationConfig( clock_array=clock_array, ground_truth=truth, noise=NoiseConfig(observation_std=0.005), n_observations=25, seed=42,))result = infer(sim.observations, InferenceConfig( clock_array=clock_array, noise=NoiseConfig(observation_std=0.005), prior=PriorConfig(position_range=(-8.0, 8.0), mass_range=(0.005, 0.15)), n_particles=400, n_masses=(1, 2, 3), ess_target=0.8, rejuvenation_steps=2, proposal_scale=2.38, seed=42,))print(f"Posterior over K: { {k: round(v, 3) for k, v in result.posterior_by_model.items()} }")print(f"Best model: K = {result.best_model}")fig, ax = plt.subplots()steps = np.arange(1, len(result.history) +1)for k insorted(result.posterior_by_model): ax.plot(steps, [h[k] for h in result.history], label=f"K = {k}")ax.set_xlabel("observation #")ax.set_ylabel("posterior probability")ax.set_ylim(-0.05, 1.05)ax.legend()plt.close(fig)fig
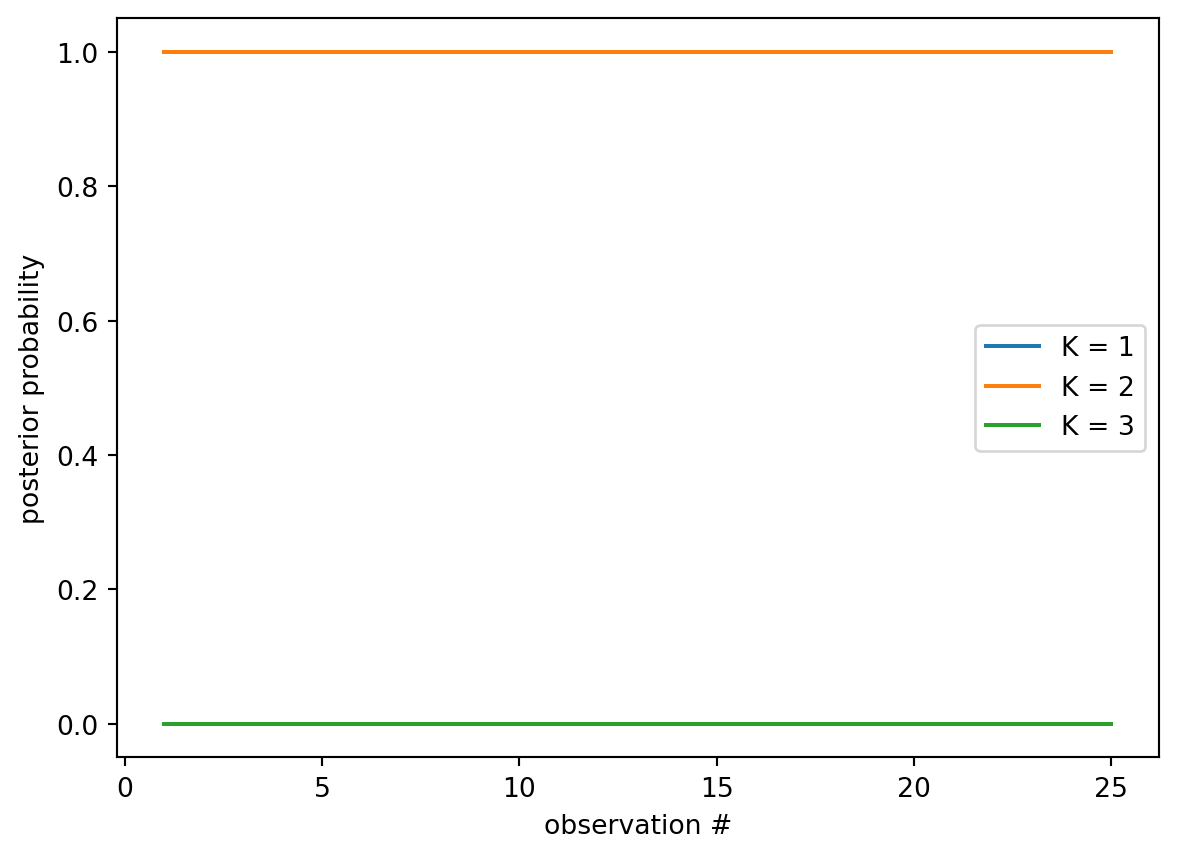
Posterior over K: {1: 0.0, 2: 0.74, 3: 0.26}
Best model: K = 2
A separate 25-observation, 400-particle estimate ends near K=2: 0.740 and K=3: 0.260 (truth: K=2).
NoteEvidence is a flow, not a snapshot
The embedded 25-observation, 400-particle calculation ends near K=2: 0.740 and K=3: 0.260, whereas the packaged 80-observation, 2,000-particle run ends near 0.3990 and 0.6010. This is not a contradiction. A different finite data horizon changes the evidence supplied by the noisy realization, and a different finite-particle budget changes the Monte Carlo estimate of that evidence. Both effects matter; the difference should not be attributed solely to Monte Carlo noise. Comparing models responsibly means examining data horizon, particle-count, and seed sensitivity rather than reading one run’s extra decimal places as certainty.